
The joy that is Source Maps (with Vue.js and TypeScript)
Published on Sunday, February 4, 2018 12:00:00 AM UTC in
Programming

My last post was about setting up a TypeScript environment to work with Vue.js using WebPack. I was amazed how simple that was and how well features like hot reloading worked. But I always want more :). For example, debugging my code using source maps. Shouldn't be too hard, right? Oh boy was I wrong.
I've spent countless hours getting source maps right for different frameworks and setups in the past. It's always been a pain and unnerving, but for some reason I thought with these new shiny tools it all must be better, simpler, straight-forward. But it's not. All in all I identified three sources of problems:
- The hot reloading feature, nice as it is, adds lots and lots of additional code that gets in your way in the debugger.
- The module packing logic of WebPack simply works, but it has a lot of potential to trip up browsers, apparently. In Chrome's dev tools, I found my application sources (and this is no joke) under:
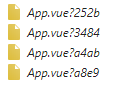
webpack-internal://node_modules/ts-loader/index.js!./node_modules/vue-loader/lib/srcUhmmmm, yeah... - Single File Components are split up, naturally, into their individual parts, but still end up with the same "file" names. To avoid overwriting each other, a hash value is added to the end, and the actual source you're looking for therefore is randomly located in one of these cryptic files - happy searching!
And, of course, if you think you got one of these issues solved, you made the other two worse - up to the point that changing some details in minor ways lets your sources disappear completely.
Hm, which one to choose today?
In the end, when I found the solution, everything seemed quite simple. Of course it's always like that. But the way to get there is a horrible experience, and the internet is full of people with the same problem seeking for help, only receiving non-working or outdated advice. Frustrating.
But enough rants, show me how it's done!
A solution
The following steps will produce clean and debuggable source maps for your TypeScript in Chrome, as of today (may be different tomorrow or when the next browser update hits, whatever comes first).
Step 1
Let TypeScript generate source maps. To this end, add the following to the "compilerOptions" section of your "tsconfig.json":
"sourceMap": true
Alright, easy!
Step 2
Tell WebPack you're serious. There's some parameter named devtool that controls how source maps are generated. In the Vue.js template for WebPack this is controlled by a property of the same name in "config/index.js" in the "dev"-section. The default value here is "cheap-module-eval-source-map". When they say "cheap", they mean performance-wise. When I say "cheap" I mean its features. Everybody and their grandma will tell you this is the option to go, but this is nonsense. We don't want no kindergarden source maps, so change that to:
devtool: 'eval-source-map',
Let me tell you why this is much better, even though it's slower than the other option. It gives you the original source map, meaning you can debug by statements. The other options limit your possibilities to lines only. While this doesn't sound like a big deal, you'll hear people whine about the implicit side effects all the time. For example, it's traditionally hard to debug async/await statements. But not with full source maps! With those, you can do this:
See? You can set breakpoints after the await part, hence effectively working around the typical problems. With lines only-debugging there would be no way to break and look at the results in this code snippet.
Update (2018-08-09): For debugging 3rd party libraries (see below), you may even need to set the devtool entry to source-map for the unaltered source maps in some cases.
Step 3
To get there, you need to clean up the mess that is the virtual file system of these source maps, or you'll always struggle to find the right file and sources. To solve this, there's this pair of parameters you can play with that really roll of the tongue easily: devtoolModuleFilenameTemplate and it's brother devtoolFallbackModuleFilenameTemplate. They control how those virtual file names are generated, and are responsible for the hash soup you've seen above.
Here's what I did: with some regex test I check to see what part of the Single File Components I'm currently looking at. The (Type-)Script parts have a corresponding "type=script" key-/value-pair in their query arguments. I use this information to move all other files (that are not of interest because they mostly contain hot reloading stuff and don't belong to the application) to a separate virtual "folder". I named it "webpack-generated://". The files that have the application code in them I move to "sources://". The side effect of this magic string is that the Chrome dev tools will display these in the root folder (and not create a separate sub-folder "sources"). Another nice thing is that using the Ctrl+P shortcut in the dev tools to open files will always offer the files in that folder first, right at the top, which is exactly what you want.
To do all this, open up "build/webpack.base.conf.js" and add the following block to the "output"-section:
devtoolModuleFilenameTemplate: info => {
  var $filename = 'sources://' + info.resourcePath;
  if (info.resourcePath.match(/\.vue$/) && !info.allLoaders.match(/type=script/)) {
    $filename = 'webpack-generated:///' + info.resourcePath + '?' + info.hash;
  }
  return $filename;
},
devtoolFallbackModuleFilenameTemplate: 'webpack:///[resource-path]?[hash]',
This gives the following structure in Chrome, in addition to the already existing clutter:
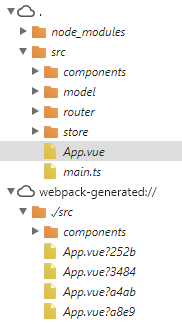
The dot-folder now only contains your app code and all referenced modules from NPM, while the webpack-generated-folder contains the stuff you typically don't want to debug nor even see.
Update (2018-08-09): For vue-loader 15+, the check should use query instead of allLoaders (thanks, @rndmerle).
Bonus: 3rd-Party Source Maps
What you will realize is that third-party libraries you pull from NPM (in your node_modules-folder) will not have their source maps loaded, even when the library provides them in its package. The reason for this is that you typically don't have a loader configured that would know how to handle them so they end up in your bundles correctly. To fix that, I recommend using the Source-Map-Loader. The setup is straight forward and as described on their page, but I recommend to only include the libraries you want to have source maps for selectively. Why? First of all it's quite some performance issue to let the loader process all of node_modules, and the other aspect is that it fails your build process if a source map cannot be found, meaning that any slightly broken package in your dependency chain will cause problems in your application build process. What I did hence was add this to my "module/rules"-section in the webpack.base.conf.js:
{
  test: /\.js$/,
  use: ["source-map-loader"],
  enforce: "pre",
  include: [resolve('node_modules/some-lib-i-probably-want-to-debug')]
},
Done! Happy debugging your TypeScript!
Tags: Fail · SourceMaps · TypeScript · Vue.js · WebPack